CAN Bus Tester
CAN BUS TESTER
A FastAPI application that allows you to generate and send CAN messages from DBC files while monitoring incoming frames on the bus through a web interface.
- View message and signal details by selecting and loading DBC files through the browser
- Automatically list CAN interfaces and channels on your system with python-can, with manual input support
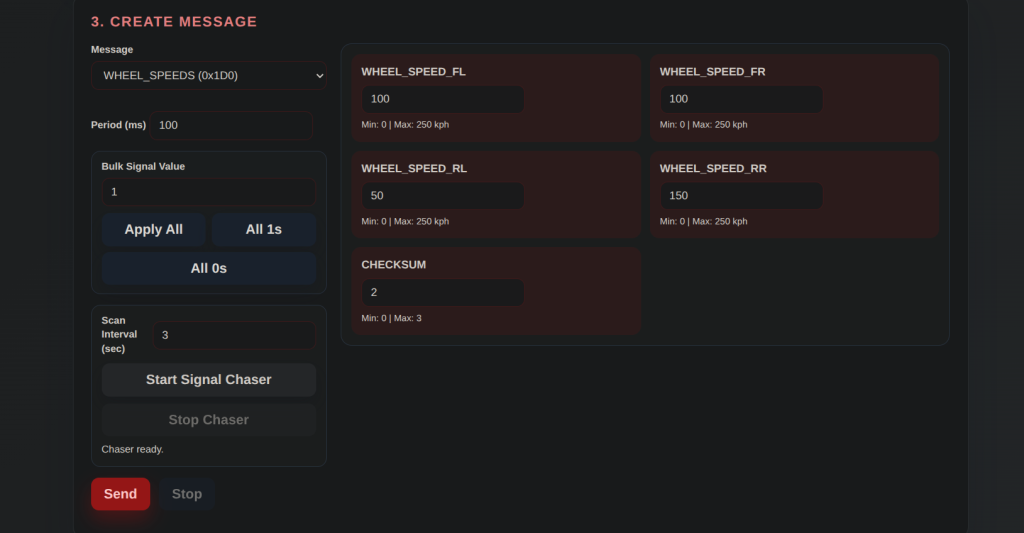
- Set signal values for the selected message and send them once or at specified intervals
- Bulk signal assignment tools to set all signals to 0/1 or a custom value with a single click
- Automatic signal chaser mode that cycles through signals of the selected message at specified intervals, setting them to max/min values
- Configure CAN interface (e.g.,
socketcan,pcan,vector) from the web panel and use default 500 kbit/s bitrate - Monitor incoming messages in real-time through WebSocket, decoding them in a modern log view
- Responsive interface with one-click toggle between light/dark mode
- Multi-language support (Turkish/English) with language selector in the header
- Save CAN traffic as named recordings and replay them later with graphical analysis
uvicorn app.main:app --reload
Then open http://127.0.0.1:8000/ in your browser to access the interface.
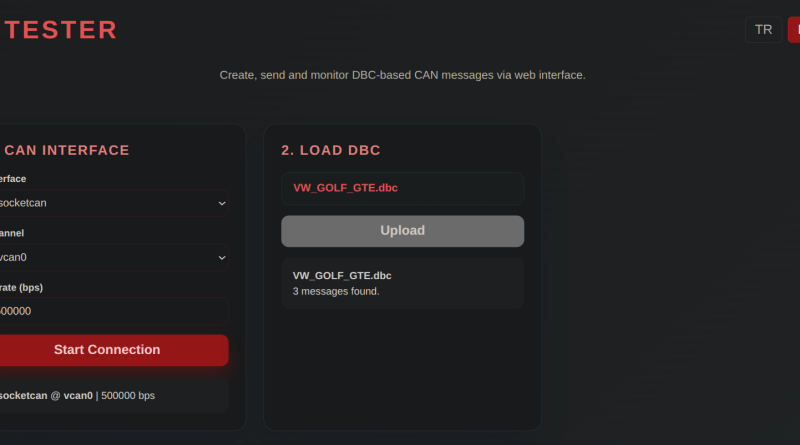
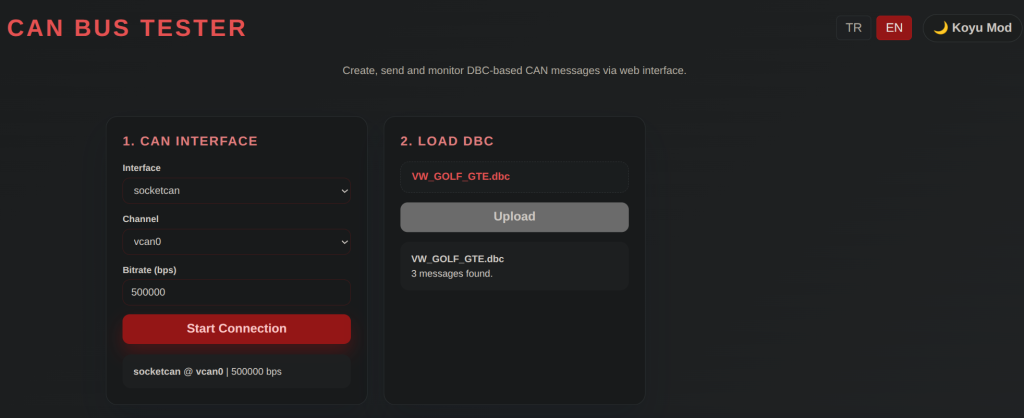
- In the CAN Interface panel, available interfaces are automatically listed; select the appropriate channel or use manual fields if needed.
- In the Load DBC section, use the file select button to choose a
.dbcfile from your local disk. Sample file:DBC/LCS_IKA_TRU.dbc. - In the Create Message panel, select a message from the list; signals are grouped horizontally in compact cards. Enter values and specify period (0 or empty = one-time).
- Click Send to transmit the frame. If periodic transmission is active, you can stop it with the Stop button.
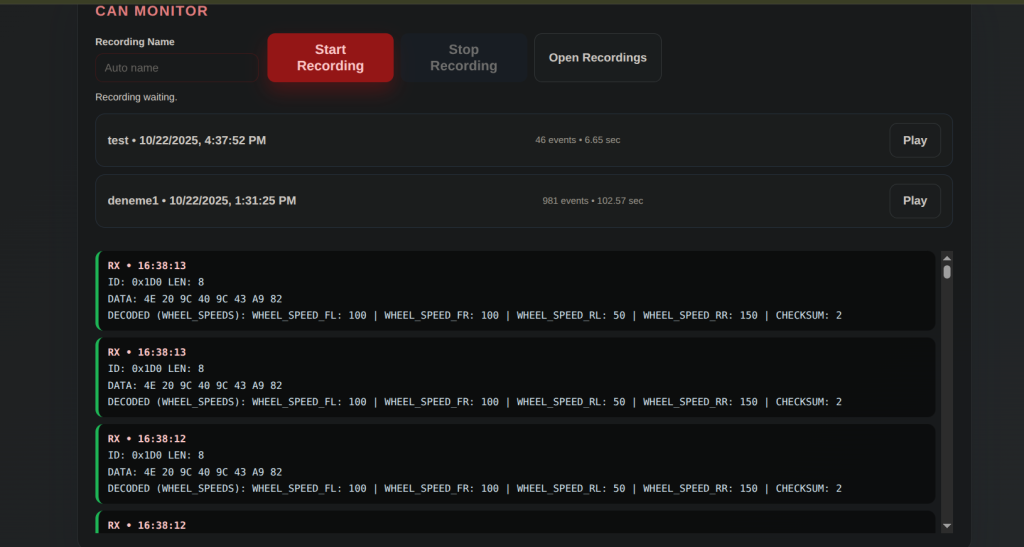
- In the CAN Monitor panel, both sent and received frames are displayed in real-time. Messages defined in the DBC are automatically decoded.
- You can start signal chaser from this panel to automatically cycle through each signal to its maximum/minimum value at specified intervals.
- Start and stop recording from the top of the monitor panel to save CAN traffic to file, then use the Open Recordings link to perform graphical analysis on the playback page.
2. Prepare a Message – Pick a message, set signal values, and define the transmit period if you need periodic sending.
3. Monitor Live Traffic – Observe transmitted and received frames, run the signal chaser, and control recordings from the monitor panel.
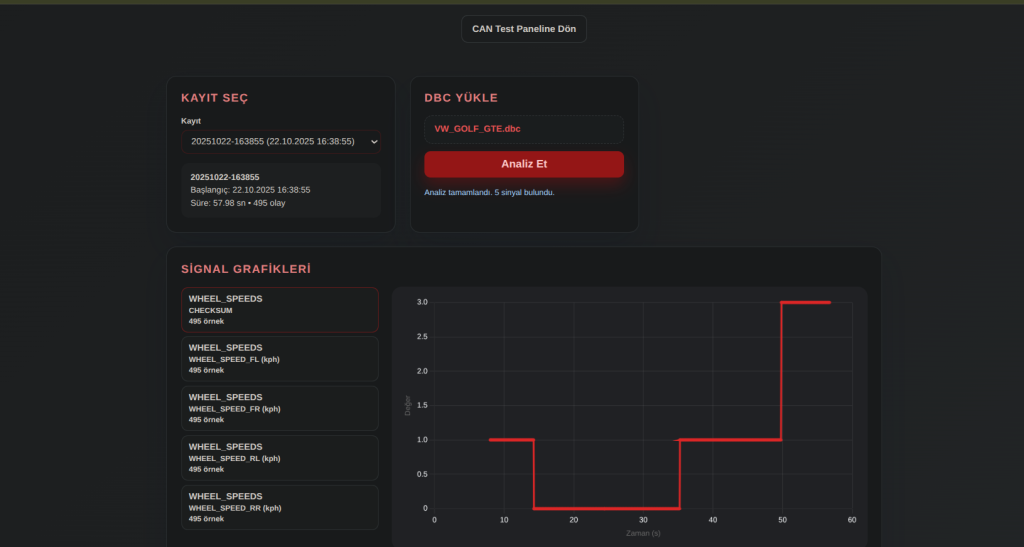
4. Analyze Recordings – Open saved recordings on the playback page to inspect signal charts and event logs.
The application supports both Turkish and English languages. Users can switch between languages using the language selector (TR/EN buttons) in the page header. The selected language preference is saved and persists across sessions.
For more details about the multi-language implementation, see LANGUAGE_SUPPORT.md.
- You can start recording by entering a recording name or leaving it blank for automatic date/time naming.
- All RX/TX events in the CAN Monitor panel are saved during recording; when you stop, it’s added to the recordings list.
- On the
http://127.0.0.1:8000/playbackpage, select a recording and load the relevant DBC file to examine signals on a timeline and view the event chronology in table format.
- The interface is prepared as a modern single-page application (SPA); FastAPI only serves the API and static files.
- Incoming messages are automatically decoded if a match is found in the DBC, otherwise raw data is displayed.
- Multiple periodic transmission keys are supported; the default key is the message name.
This project is prepared for demonstration purposes; you can continue development as you wish.